Skills you leave with
What you'll learn
Prerequisites
Comfortable with computers and basic math. Spreadsheet experience helpful but not required. No coding needed to start.
Curriculum
Structured in phases
7 phases · tap any phase to expand the details.
What a data analyst does, the analysis workflow (collect → clean → analyze → present), types of data, and where analysts actually work in this region (NGOs, government, business, research).
Meet your mentor
Your instructor
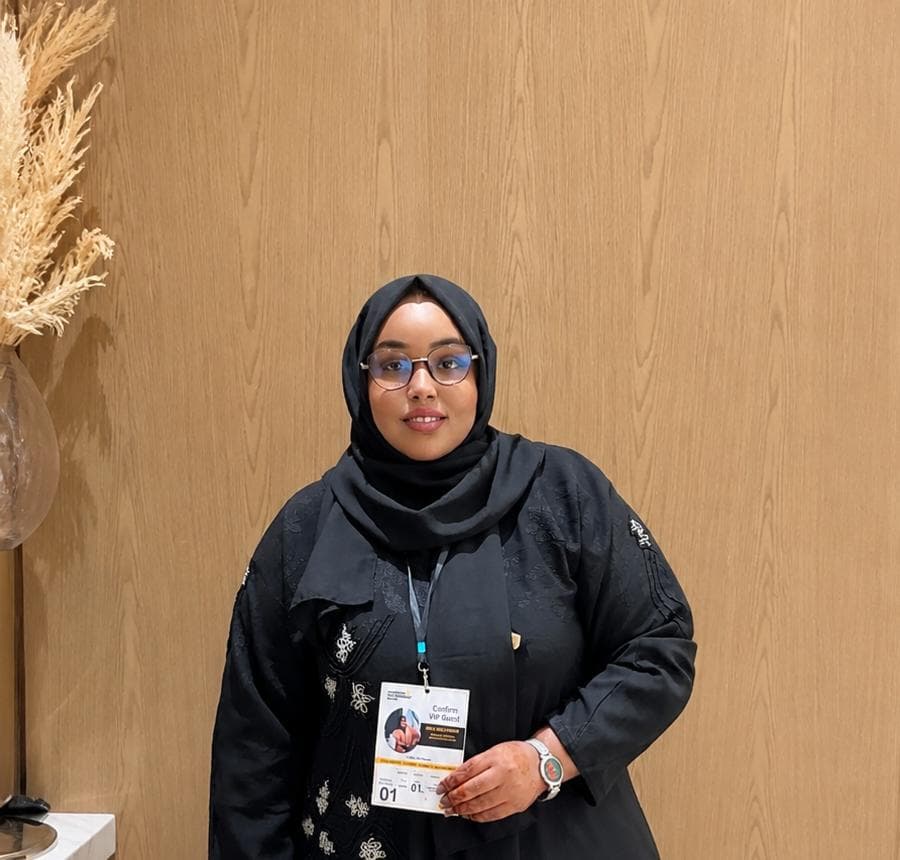
Asia Saed Hassan is a Design Thinking facilitator, skills trainer, and certified in the Google Data Analytics Specialization, currently pursuing a Master's degree in Research and Data Analysis, with over five years of experience in training facilitation, field research, and capacity building.
She has worked with leading institutions including the Pharo Foundation, HarHub, Sahan Research and Consulting Center, CSI Burao, the Somaliland Ministry of Trade and Tourism, and 2DOON. To date, Asia has trained over 500 aspiring entrepreneurs and young professionals, equipping them with the practical skills needed to succeed in today's job market.
5+
years training & research
500+
professionals trained
certified data analyst
The full story
About this course
Data Analytics takes you from raw data to clear insights and dashboards, the full analyst pipeline: collect, clean, analyze, and present. It's job-oriented from the first week, built around the work analysts actually do here.
You learn the tools employers in this region really hire for: Excel for everyday analysis, KoboToolbox for collecting field data (a real, in-demand NGO and government skill most courses skip), SPSS for statistics, SQL for querying databases, and Power BI or Looker Studio for dashboards.
You finish with a capstone in your portfolio: a real dataset taken from collection to insight, presented as a dashboard, and the exact skill set NGOs, government, and businesses around you look for.
